As performance topic usually focuses on how the application is running, let’s shift the attention to how the application starts. This topic is just as important as it is usually neglected. Let us dive deeper into Android startup modes, measuring startup times (yes, there’s more than 1) and monitoring these values in production application.
Startup types
To understand measurements and to start thinking about optimization we first need to know that there is more than 1 way the app starts on an Android device.

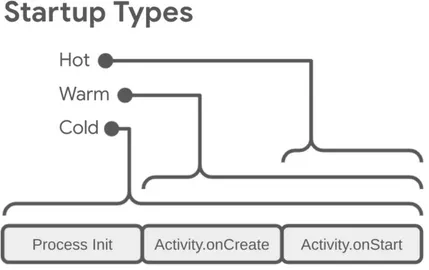
Let’s start from the biggest to smallest scope — cold start
Cold starts happen in cases such as your app launching for the first time since the device booted or since the system killed the app. Described step by step it would look like this:
- Load and launch the app.
- Display a blank starting window for the app immediately after launch.
- Create the app process.
- Create the app object.
- Launch the main thread.
- Create the main activity.
- Inflate views.
- Layout the screen.
- Perform the initial draw.
There is also 1 hidden step- when the app process completes the first draw, the system process swaps out the displayed background window, replacing it with the main activity. At this point, the user can start using the app.
As you can see that is already a lot of work happening that we cannot really influence. It will happen regardless of what the app needs to do in terms of initializing itself. This whole process can take anywhere from 150ms up to 500ms depending on device or framework used. Fortunately for us, cold start timing is pretty generous- as defined by Google cold start should take less than 5 seconds, which should be more than enough time (for example) for a freshly installed app to be fully operational.
Warm start — our biggest worry
Warm start picks necessary tasks from cold start after the app process is still initialized. There are many potential states that can be considered warm starts, such as:
- The user backs out of your app but then re-launches it. The process might continue to run, but the app must recreate the activity from scratch using a call to onCreate().
- The system evicts your app from memory and then the user re-launches it. The process and the activity needs to restart, but the task can benefit somewhat from the saved instance state bundle passed into onCreate().
Warm start is the most common startup type our users will have to see when launching our application. Its recommended timing is under 2 seconds, which is where things might get complicated really fast.
Last & definitely the least — Hot start
In a hot start, the system brings your activity to the foreground. If all of your app’s activities are still resident in memory, then the app can avoid repeating object initialization, layout inflation, and rendering. 2 things to keep in mind about hot start:
- If some memory is purged in response to memory trimming events, such as onTrimMemory(), then these objects need to be recreated in response to the hot start event.
- A hot start displays the same on-screen behavior as a cold start scenario. The system process displays a blank screen until the app finishes rendering the activity.
Recommended timing for hot start is 1.5 seconds, but usually if most of the app is still in-memory this is a really high bar to mess up.
Now that we have our startup types defined and understood let’s move on to how and where we can measure both of the startup values and what is the difference between them.
- Time To Initial Display (TTID) — time it takes to display the first frame of the app (splash screen not included), usually main activity or loading screen
- Time To Fully Drawn (TTFD) — when the app is actually usable.
TTID
It’s the time it takes to display the first frame of the app’s UI. It’s reported automatically for every app by the Android Framework. It’s measured as a time value that represents the total elapsed time that includes the following sequence of events:
- Launching the process.
- Initializing the objects.
- Creating and initializing the activity.
- Inflating the layout.
- Drawing the app for the first time.
We can get this value from 2 places:
- Android Vitals
- Terminal/Logcat
As mentioned earlier, this value is collected automatically by the OS and stored in Play Store Console’s Android Vitals tab. This means you can have an overview of startup performance from all your users and you don’t even know it! Be sure to check it out under Android Vitals — loading tab.
Measure it yourself
If you don’t have your app in store yet or just want to test startup locally there are 2 ways to go about it depending if you want to use Android Studio or not.
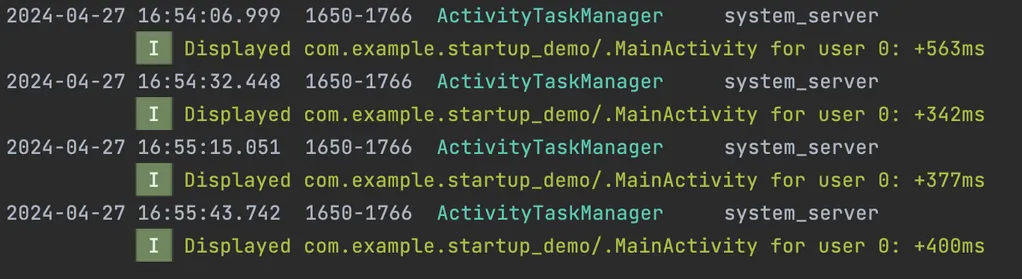
Starting with the more user friendly way — connect your phone with enabled debugging to a computer of choice -> launch Android Studio -> open Logcat -> clear all filters -> type “Displayed” . This way you should see output like this:
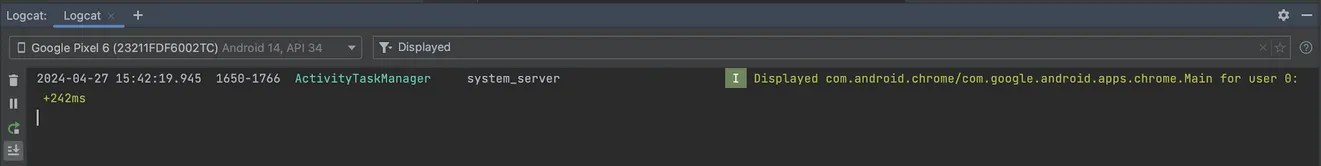
As you can see — added bonus of checking TTID locally is that you can inspect this value for any app that you have installed. This provides a great benchmark for when you’re trying to compete with other apps of the same type.
The other way of accessing this value without Android Studio is by using plain old terminal. Make sure you have ADB tools downloaded, then open terminal and run adb logcat | grep Displayed You should see an output like this

Now we have an understanding of startups and can find information about our startup performance among our userbase, as well as can measure it ourselves. There is just one more aspect to talk about briefly before going to optimization — a very philosophical aspect really.
“Define good performance”
Was a surprising sentiment I heard at work when working with this topic. We’re here talking about ranges, measurements but for the client what’s most important is what is good, what’s best for them. Unfortunately to my knowledge there is no definition of good outside of the ranges provided by Google:
- Cold startup takes 5 seconds or less.
- Warm startup takes 2 seconds or less.
- Hot startup takes 1.5 seconds or less.
All this is not an exact science by any means. Even on the same devices under the same circumstances the results may vary, typically within 200ms threshold. This is — again — outside of our influence. For example these factors could impede startup time for your users:
- Available device RAM
- Network connection quality
- Current CPU load
With that out of the way we can finally move on to the meat and potatoes of this whole topic — optimizing our Flutter app!
Initializing global services
Is a pain in many body parts. Usually the recommendation is to put them above the runApp() Usually they are async methods taking god-knows how long and the more services you need the longer the whole operation takes. What can be done in flutter is combining async calls. Let’s take a look at example below:
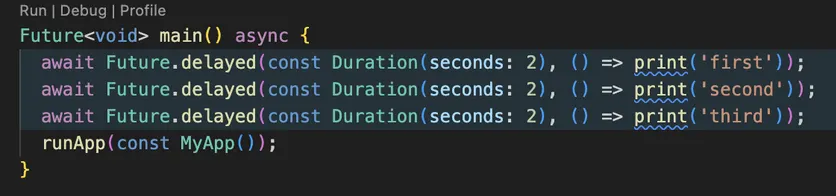
I know that 3 services initializing for 2 seconds each is a bit of an overshot but we are on a tight budget — remember that warm start should be lower than 2 seconds and runApp() will show the initial frame counted as TTID. In the example above the TTID was 6 seconds 464ms.
Alternatively imagine initializing 6,7 or why not 15 services. Even if each takes 150ms it will still add up to 2.2 seconds and its game over (I mean nothing really happens but I wanted to somehow emphasize that we’re already over the limit).
The solution to that is really simple and already built-in in Flutter — Future.wait() This method runs all futures at the same time which already can massively improve our initialization timings. Just by doing this
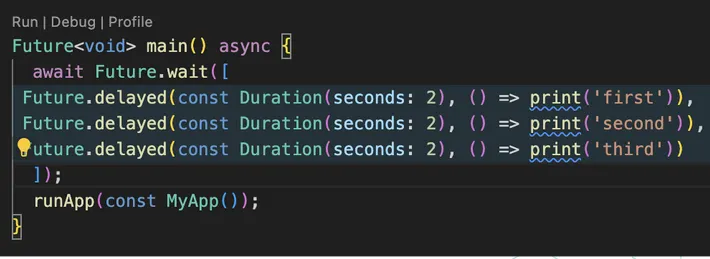
we have a result of 2 seconds 465ms. Compared to our previous score of 6 seconds 464ms this is lightning fast.
Honorable mention — Splash screen
Splash screen does not count in TTID measurement even though it technically is the first frame that user sees. But using it incorrectly can increase our TTID metric. That’s why I felt it’s necessary to mention it here. Just really simple things to keep in mind:
- Animated good — too long bad
- Migrate your old project from Flutter’s 2.5 splash api
- Migrate to Android 12 splash screen implementation
- You can set up splash screen that uses app icon from user’s display
Now for the big reveal
This whole article and my dive into this rabbit hole were inspired by a simple trick I discovered which is not really mentioned in many places — you can run runApp() more than once. I know, shocking. What this method actually does is inflates a given widget to fill the device’s screen. Doesn’t sound scary, right? So what happens if its called a second time?
Calling [runApp] again will detach the previous root widget from the screen and attach the given widget in its place.
That also doesn’t sound all that bad. But just to be sure — what happens if you detach a root widget?
The new widget tree is compared against the previous widget tree and any differences are applied to the underlying render tree, similar to what happens when a [StatefulWidget] rebuilds after calling [State.setState].
Which would mean that not only running this method is harmless, it’s also something all of us do on a regular basis when using stateful widgets. Well, in that case let’s take our sample application for one last spin. We already improved startup time by about 66%. Lets see what happens when we do this:
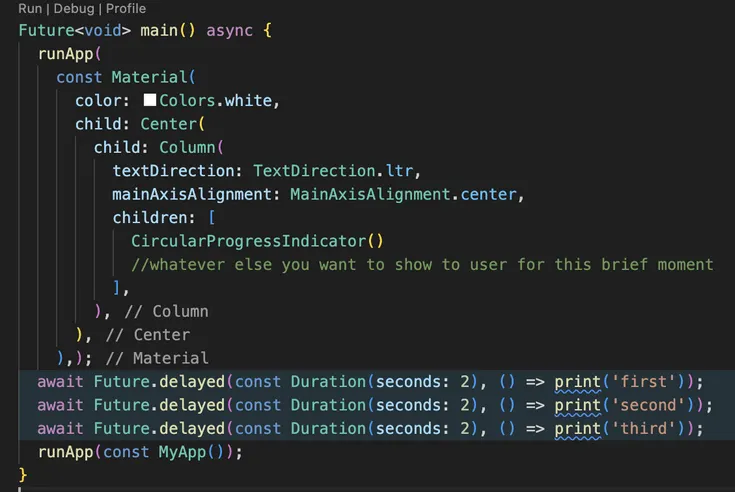
Now you may notice I “unpacked” the future calls for the worst time possible. Yet, when the app is being started repeatedly this is the result:
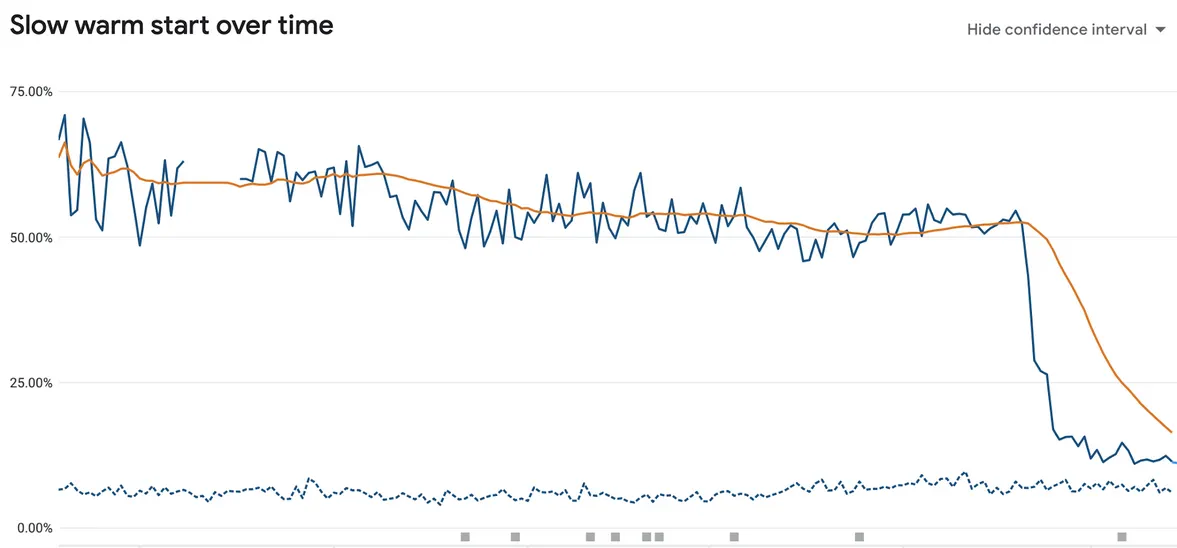
Now the skeptical of you could say that everything is possible on demo/example applications. Would it have any real life usage in production? The answer is a resounding yes! Deploying our application to millions of users with this (and few other confidential changes) produced this output in Android Vitals:
Now just remember that with great power comes great responsibility. Always see if your code is in the absolute best shape before resorting to tricks like these.
I know that after reading all this you just want to rush to your project to test the things I mentioned. Just please keep these few points in the back of your mind:
- Always measure your TTID
- Always group futures that are not dependent on each other
- Use native SplashScreen that extends app icon
- Use Android vitals to understand your end-users and their experience
- Rethink if your architecture is as optimal as possible (do you really need this function before app is responsive?)
- If possible use multiple runApp() methods to optimize TTID/UX
And 1 more topic currently unavailable for Flutter but worth keeping in mind is baseline profiling. According to Google when implemented properly this gives code execution speed a boost of 30%. But that’s a topic for a whole another article ;)
Just as a footnote — this was a topic presented by me on Flutter Meetup Prague. Check out Flutter Meetup group to see if there are events happening near you ;)